TOOLS
C. elegans RNAi feeding library
Original publications:
Fraser, A., Kamath, R.K., Zipperlen, P., Martinez-Campos M., Sohrmann, M. and Ahringer, J. (2000) Functional genomic analysis of C. elegans Chromosome I by systematic RNA interference. Nature, 408, 325-330.
Kamath, R.S., Fraser, A.G., Dong, Y., Poulin, G., Durbin, R., Gotta, M., Kanapin, A., Le Bot, N., Moreno, S., Sohrmann, M., Welchman, D., Zipperlen, P., and Ahringer, J. (2003) Systematic Functional Analysis of the C. elegans Genome using RNAi. Nature, 421, 231-237.
The RNAi library, including 3500 additional clones, is available from Source Bioscience
MosSCI and gateway compatible plasmid toolkit for constitutive and inducible expression of transgenes in C. elegans
Original publication: Zeiser, E., Frøkjær-Jensen, C., Jorgensen, E., and Ahringer, J. (2011) MosSCI and Gateway compatible plasmid toolkit for constitutive and inducible expression of transgenes in the C. elegans germline, PlosOne, 6(5):e20082.
Plasmids are available from Addgene.
SOFTWARE
SeqPlots - A fast interactive web tool for plotting signals across genomic features
Przemysław Stempor and Julie Ahringer
Summary
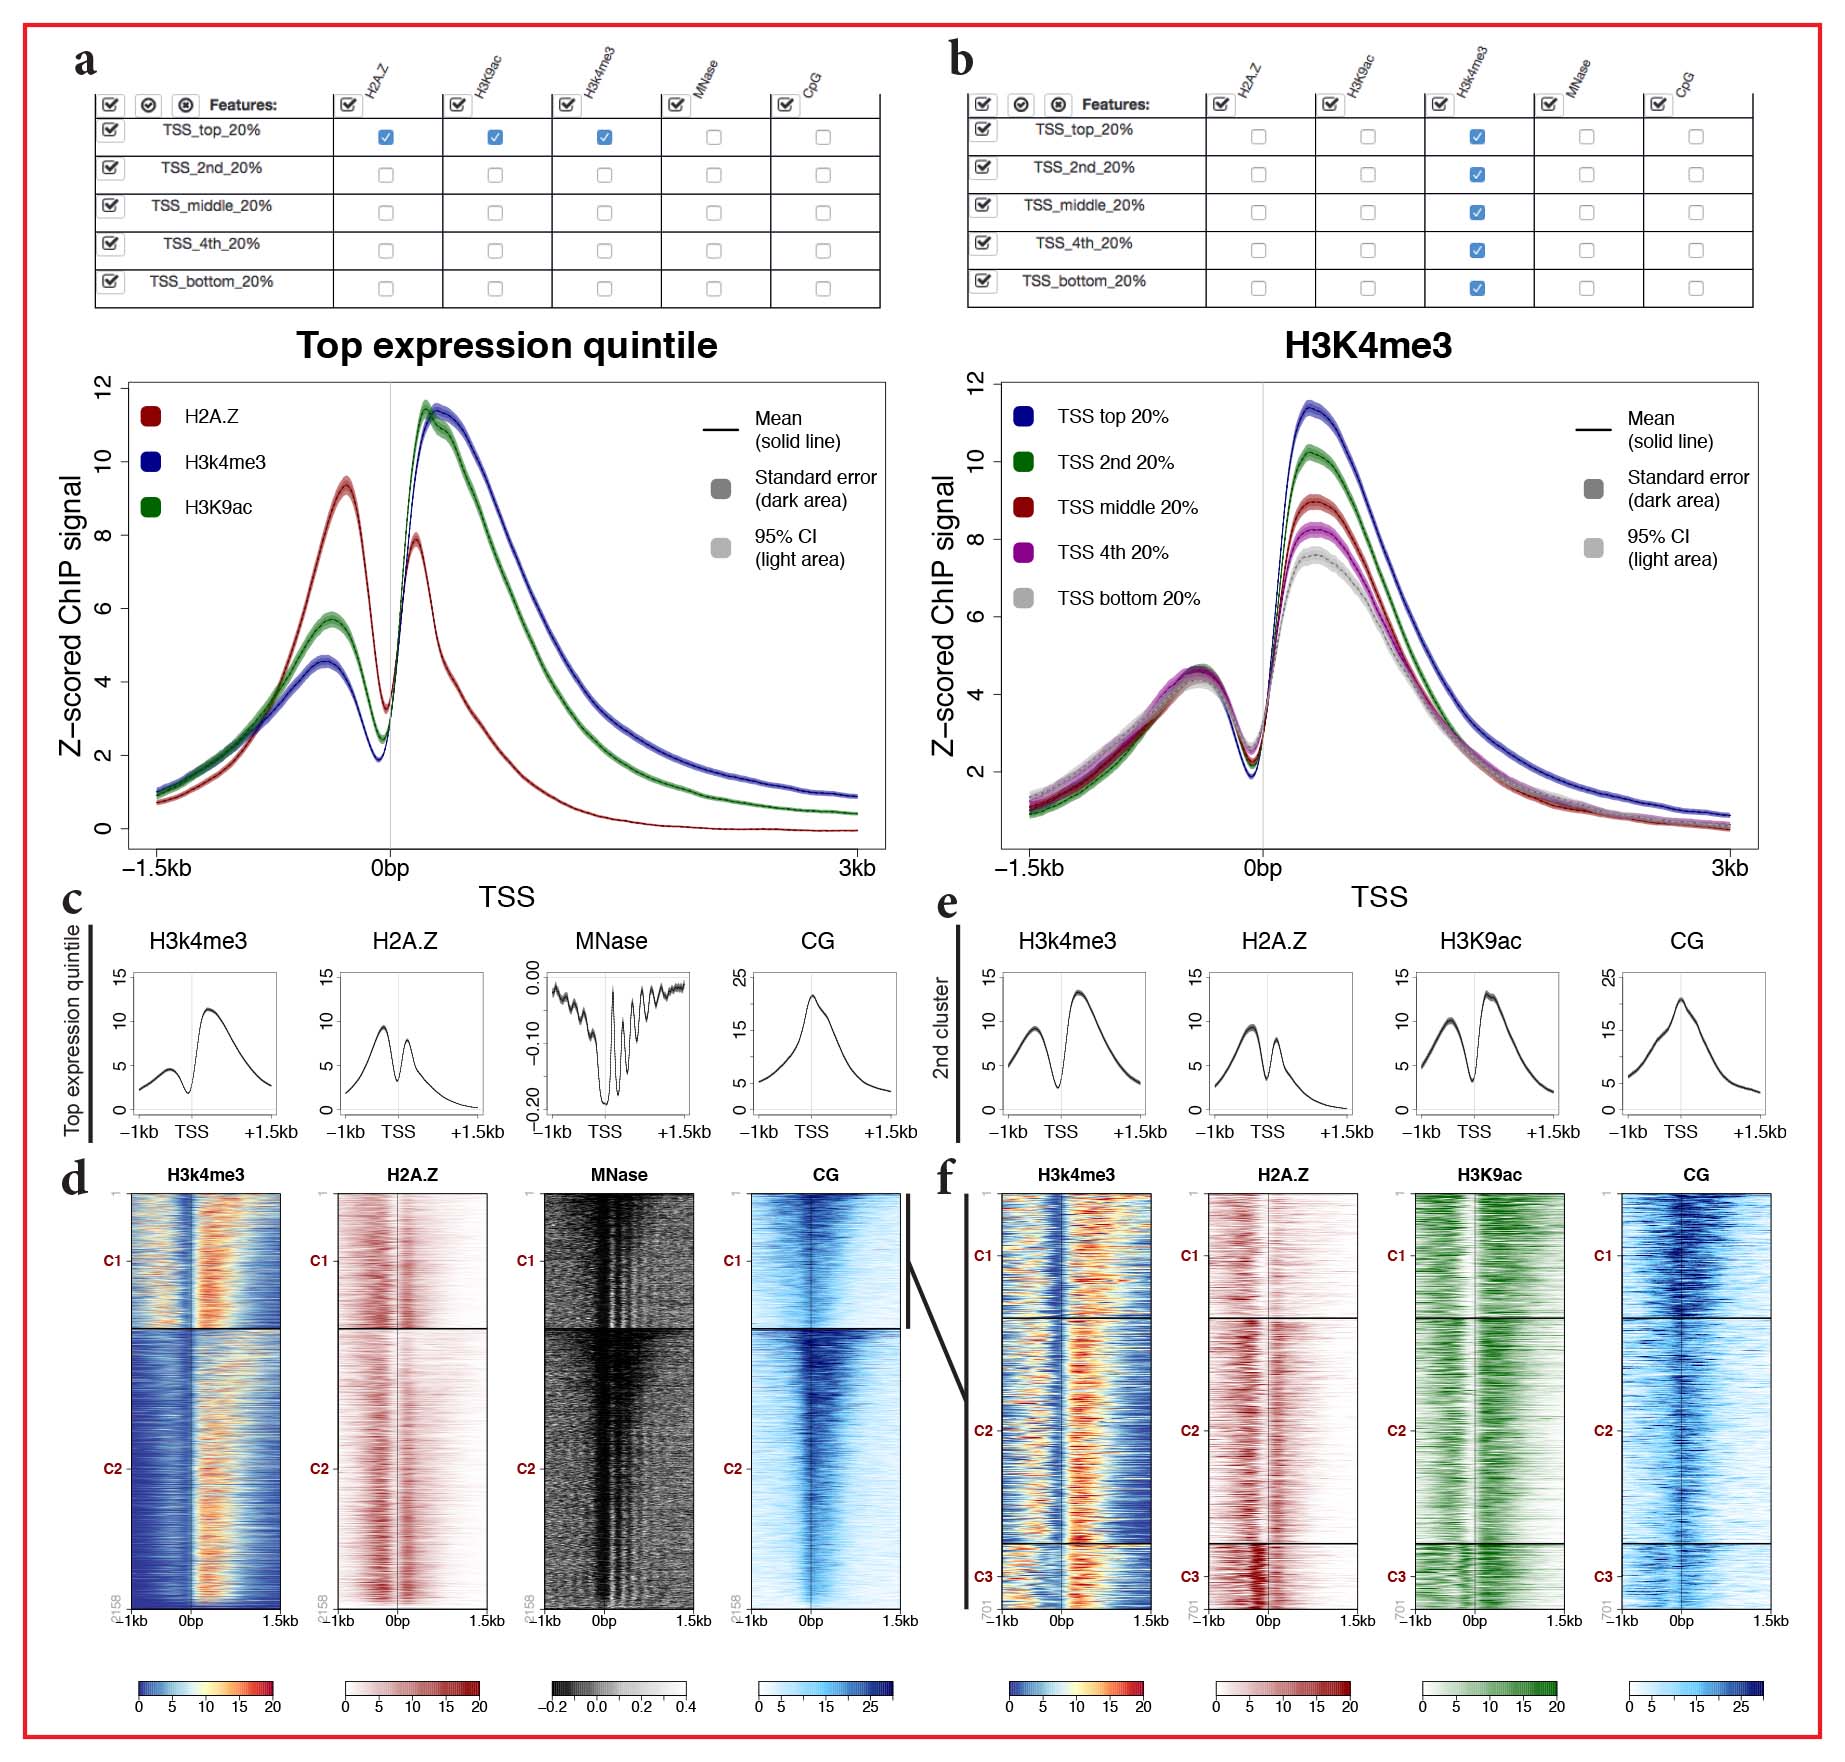
Experiments involving high-throughput sequencing are widely used for analyses of chromatin function and gene expression. Common examples are the use of chromatin immunoprecipitation for the analysis of chromatin modifications or factor binding, enzymatic digestions for chromatin structure assays, and RNA sequencing to assess gene expression changes after biological perturbations. To investigate the pattern and abundance of sequence signal across regions of interest, data are typically visualized using aggregate plots or stacked rows of signal in the form of heat maps. We found that available plotting software was either slow and laborious or difficult to use by biologists with little computational training. To address this need, we developed SeqPlots, a user-friendly GUI application that runs on all common operating systems as a web browser application. After selecting sets of signal and feature files and choosing plotting parameters, users can plot of any combination of signal and feature as an aggregate plot or heat map in a matter of seconds simply by clicking a grid. Output is highly configurable and batch operations can generate a large number of plots at once. The design and ease of use of SeqPlots encourages wide data exploration, which should aid the discovery of novel genomic associations.
Availability and Implementation
A description of SeqPlots, including a manual and how to obtain the software is available here. SeqPlots is available as an R package from the Bioconductor repository or as a standard Mac OSX application. SeqPlots can also be deployed on a server as shared web application. The source code and open development tools (wiki, bug tracker, pull requests) are available via GitHub.
Systematic bias in high-throughput sequencing data and its correction by BEADS
Original publication: Cheung MS, Down TA, Latorre I, Ahringer J. (2011) Nucleic Acids Res. doi: 10.1093/nar/gkr425.
R implementation of BEADS: (Przemysław Stempor)